阿摩線上測驗
7. The Temperature(T)-Entropy(S) diagram of the Carnot cycle is shown in the right figure (solid line). What area in the T-S diagram represents the work done by the system in each cycle?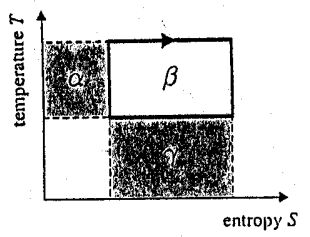
(A) α
(B) β
(C) γ
(D) α + β
(E) β + γ
答案:登入後查看
統計: 尚無統計資料
統計: 尚無統計資料