 阿摩線上測驗
題組內容
II. ESSAY (15 points each).
1. The figure above shows the initial aggregate demand curve, AD0, the initial short-run aggregate supply curve, SAS0, and the long-run aggregate supply curve, LAS. The points in the figure show possible combinations of real GDP and the price level at which the economy of Taiwan is in macroeconomic equilibrium. The economy is initially at point A. Then, the government increases its purchases of goods and services. Draw the new aggregate demand and short-run aggregate supply curves in the figure to show the effects of this event on Taiwan's real GDP and price level.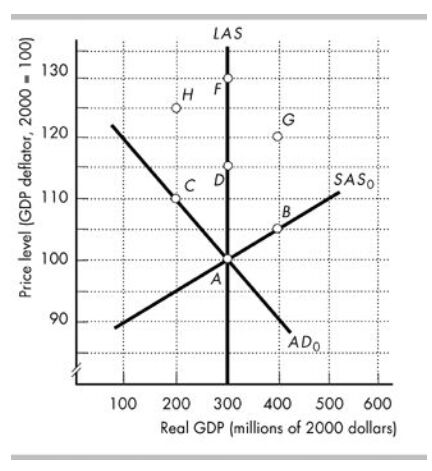
a) What happens to Taiwan's potential GDP?