所屬科目:研究所、轉學考(插大)-微積分
1. Which of the following would be an appropriate alternative hypothesis? (A) The mean of a population is equal to 70. (B) The mean of a sample is equal to 70. (C) The mean of a population is greater than 70. (D) The mean of a sample is greater than 70.
2. Two independent simple random samples are taken to test the difference between the means of two populations whose variances are not known, but are assumed to be equal. The sample sizes are $n_1 = 32$ and $n_2 = 40$. The correct distribution to use is the (A) t distribution with 73 degrees of freedom. (B) t distribution with 72 degrees of freedom. (C) t distribution with 71 degrees of freedom. (D) t distribution with 70 degrees of freedom.
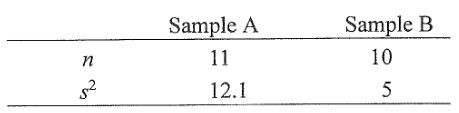
3. Based on the sample evidence below, we want to test the hypothesis that population A has a larger variance than population B. The test statistic for this problem equals (A) 1.4. (B) 1.1. (C) 2.42. (D) 2.
4. Two events, A and B, are mutually exclusive and each have a nonzero probability. If event A is known to occur, the probability of the occurrence of event B is (A) one (B) any positive value (C) zero (D) any value between 0 to 1
5. If the mean of a normal distribution is negative, (A) the standard deviation must also be negative (B) the variance must also be negative (C) a mistake has been made in the computations, because the mean of a normal distribution cannot be negative (D) None of these alternatives is correct.
6. The random variable x is the number of occurrences of an event over an interval of ten minutes. It can be assumed that the probability of an occurrence is the same in any two time periods of an equal length. It is known that the mean number of occurrences in ten minutes is 5.3. The random variable x satisfies which of the following probability distributions? (A) normal (B) Poisson (C) binomial (D) Not enough information is given to answer this question.
7. As the sample size becomes larger, the sampling distribution of the sample mean approaches a (A) binomial distribution (B) Poisson distribution (C) normal distribution (D) chi-square distribution
8. The owner of a local nightclub has recently surveyed a random sample of n = 300 customers of the club. She would now like to determine whether or not the mean age of her customers is over 35. If so, she plans to alter the entertainment to appeal to an older crowd. If not, no entertainment changes will be made. The appropriate hypotheses to test are: (A) \( H_{0}:\mu \geq 35 \) vs. \( H_{a}:\mu < 35 \) (B) \( H_{0}:\mu \leq 35 \) vs. \( H_{a}:\mu >35 \) (C) \( H_{0}:\overline{\mathbf{X}}\geq 35 \) vs. \( H_{a}:\overline{\mathbf{X}} < 35 \) (D) \( H_{0}:\overline{\mathbf{X}}\leq 35 \) vs. \( H_{a}:\overline{\mathbf{X}} >35 \)
9. When the following hypotheses are being tested at a level of significance of a $H_0: \mu \ge 500$$H_a: \mu < 500$ the null hypothesis will be rejected, if the p-value is (A) \( \leq a \) (B) \( >a \) (C) \( = a / 2 \) (D) \( \leq 1 - a / 2 \)
10. An estimator that has small variance (but may be biased) is called precise. An estimator that has small MSE (Mean squared error) is called accurate. To illustrate: A standard 100-gm mass was weighted many, many times, on scale A. Similarly, on scale B, and finally on scale C. The distribution of measurements is summarized belowScale A: $\mu=100.08, \sigma=0.01$ Scale B: $\mu= 99.98, \sigma=0.02$ Scale C: $\mu=100.00, \sigma=0.05$ Which scale is most precise? Which scale is most accurate? (A) B is most precise, A is most accurate (B) A is most precise, B is most accurate (C) A is most precise and is also most accurate (D) B is most precise and is also most accurate (E) Since the population mean is not given, there is no answer to this question. I
a. Define the random variable Y to be the time between arrivals of customers at the drive-up window of a bank. Write the probability density function for Y.
b. Find the mean and variance of Y.
a. Create the ANOVA table.
b. Test at the \( 5\% \) significance level to determine if time differences exist among the different keyboard configurations.
a. Develop a least-squares estimated regression line.
b. Develop a \( 90\% \) confidence interval for estimating the average price of books that contain 800 pages.
a. Write the estimated regression equation for the relationship between the variables.
b. Compute the multiple coefficient of determination and fully interpret its meaning.
c. Carry out a test to determine whether \( y \) is significantly related to the independent variables. Use a .05 level of significance.
d. Carry out a test to determine if there is a significant relationship between \( x_{1} \) and \( y \). Use a .05 level of significance.
 阿摩線上測驗
登入