 阿摩線上測驗
9. The indifference curve in the figure on the above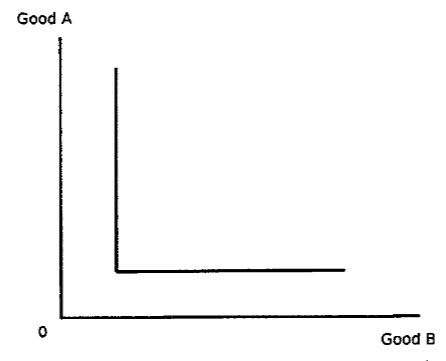
(A) illustrates two goods that are perfect substitutes.
(B) illustrates two goods that are perfect complements.
(C) violates assumptions about preferences.
(D) illustrates the utility function of \( \mathrm{U} = \max \) (quantity of good A, quantity of good B)
答案:登入後查看
統計: 尚無統計資料
統計: 尚無統計資料