 阿摩線上測驗
題組內容
3. The following diagram illustrates a competitive firm's cost curves. MC, ATC, and AVC represent the firm's marginal costs, average total costs, and average variable costs respectively. P denotes the market price and q denotes the quantity of the good.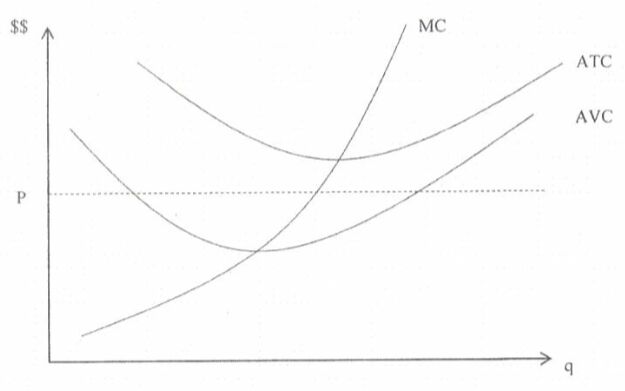
(a) Replicate the graph in your answer sheet. Then in your graph identify (i) the profit or loss for this competitive firm and (ii) the total variable cost and (iii) total fixed costs for this firm. (6 pts)